
A physiological and pathophysiological reference
Compiled and curated by Soumick Mondal Raj and Claude Science
Written for clinical teaching use. Every quantitative claim is sourced to a named study with its PMID, design and sample size; the graded evidence table is Appendix D. Where a claim rests on mechanistic synthesis rather than a single measurement, that is stated.
This document describes published physiology. It is not clinical guidance for any individual, and the figures in it are population values, not prescriptions.
Contents
Part I — The energy system · Part II — Normal regulation · Part III — How insulin resistance develops · Part IV — Why weight behaves differently · Part V — The physiology of weight loss · Part VI — The evidence, graded · Part VII — Clinical implications · Appendices
PART I — THE ENERGY SYSTEM
1. Energy balance: what the identity says, and what it does not
Change in body energy stores = energy in − energy out. This is thermodynamics and it is not negotiable. But it is an identity, not a mechanism, and three things it does not say are the source of most confusion in this field.
It does not say the two sides are independent. Energy out falls when energy in falls — that is the plateau in §31. It does not say which tissue the change comes from; the same deficit can be paid from fat, from glycogen, from protein or from body water, and those have radically different meanings. And it does not say anything about the rate at which a given deficit is paid from fat, which is precisely what hormonal state governs.
So the correct framing is: energy balance determines how much total tissue energy changes. Hormonal state determines which tissue, how fast, and how visibly.
2. The body’s fuel stores
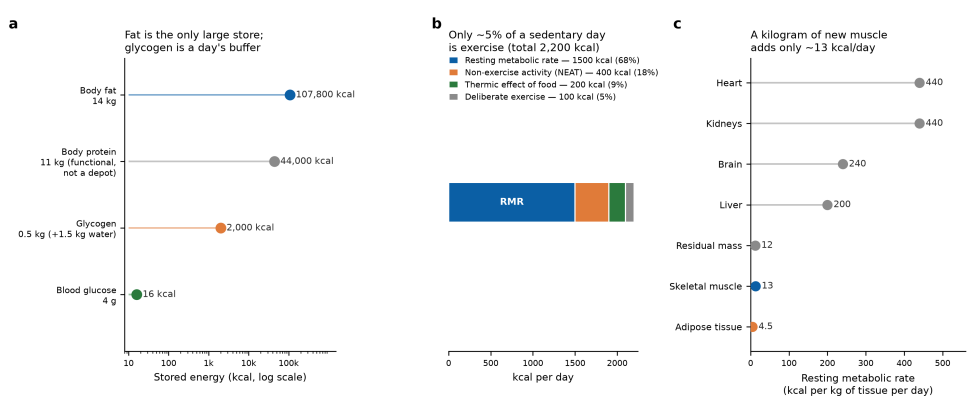
For a reference 70 kg adult at 20 per cent body fat:
| Store | Mass | Energy | Notes |
| Adipose triglyceride | ~14 kg | ~107,800 kcal | Anhydrous, 9 kcal/g; ~7,700 kcal per kg of adipose tissue |
| Body protein | ~11 kg | ~44,000 kcal | Functional tissue, not a depot — losing a third is fatal |
| Glycogen | ~0.5 kg | ~2,000 kcal | Liver ~100 g, muscle ~400 g; carries ~1.5 kg of water |
| Blood glucose | ~4 g | ~16 kcal | A few minutes’ supply |
Three consequences follow from these magnitudes.
Fat is the only store with meaningful capacity — about 54 times the energy in glycogen. It is anhydrous and energy-dense precisely because it is designed for long-term storage.
Glycogen is a buffer, not a reserve. Two thousand kilocalories is roughly one day of expenditure. It exists to bridge meals and to supply anaerobic work, not to survive scarcity.
Glycogen is hydrated and fat is not. Each gram of stored glycogen is held with roughly 3 g of water (Olsson & Saltin, PMID 5475323). So 500 g of glycogen is 2 kg on the scale but only 2,000 kcal of energy. Fat is 14 kg on the scale and 107,800 kcal. Per kilogram of body weight, glycogen carries about one seventieth of the energy that fat does. This single asymmetry explains nearly every misleading scale reading in clinical practice.
3. Where ingested energy goes — the four fates
Energy entering the body has exactly four destinations: immediate oxidation to ATP; storage as glycogen, triglyceride or protein; dissipation as heat (obligatory thermogenesis of digestion and processing, plus adaptive thermogenesis); and excretion, which in health is a small and roughly fixed loss in stool and urine.
Macronutrients differ in how they distribute across these. Protein has the highest thermic effect — roughly 20–30 per cent of its energy is dissipated in processing — against 5–10 per cent for carbohydrate and 0–3 per cent for fat. Protein also cannot be stored: there is no protein depot, so surplus amino acids are deaminated and the carbon skeletons oxidised or converted. Carbohydrate is stored as glycogen until the depot fills, after which the excess is oxidised preferentially and, under sustained surplus, converted to fat by hepatic de novo lipogenesis. Dietary fat is the only macronutrient stored with near-perfect efficiency.
4. The components of daily expenditure
Panel b of the figure above. For a sedentary adult at about 2,200 kcal/day:
- Resting metabolic rate, ~1,500 kcal, 68 per cent. Organ function at rest.
- Non-exercise activity thermogenesis (NEAT), ~400 kcal, 18 per cent. Walking, standing, fidgeting, occupational movement. The most variable component between individuals of the same size (Levine, PMID 15102614).
- Thermic effect of food, ~200 kcal, 9 per cent. Set largely by protein intake.
- Deliberate exercise, ~100 kcal, 5 per cent.
Exercise is a small fraction of expenditure in anyone who is not an athlete. This is why exercise is a weak weight-loss tool and why NEAT, which nobody schedules, is the larger modifiable term.
5. Organ-level metabolic rate — why “muscle burns calories” is overstated
Panel c. Resting metabolic rate per kilogram of tissue (Elia’s values, as compiled by Wang, PMID 21484913):
| Tissue | kcal/kg/day |
| Heart | 440 |
| Kidneys | 440 |
| Brain | 240 |
| Liver | 200 |
| Skeletal muscle | 13 |
| Adipose tissue | 4.5 |
The organs that dominate RMR are small and metabolically furious. Skeletal muscle is large and metabolically quiet at rest. Adding 2 kg of muscle adds about 26 kcal/day — nothing.
This matters because it corrects the usual rationale for resistance training. Muscle is not valuable because it burns energy at rest. It is valuable because it is the glucose sink (§20, §38) and because preserving it preserves function. The metabolic-furnace argument is quantitatively false and should not be used.
6. Fuel selection and the respiratory quotient
Oxidising carbohydrate consumes one molecule of O₂ per CO₂ produced: RQ = 1.0. Fat oxidation yields RQ ≈ 0.70. Whole-body RQ therefore reports which fuel is being burned.
In health, RQ swings widely across a day — toward 1.0 after a carbohydrate meal, toward 0.75 in the overnight fast. That swing is metabolic flexibility, and its loss is a defining feature of insulin resistance (§22).
7. The hormonal switch between fed and fasted
The system has one dominant anabolic signal and several catabolic ones, and they are reciprocal rather than independent.
Insulin rises with feeding. At the adipocyte it inhibits hormone-sensitive lipase and adipose triglyceride lipase, and activates lipoprotein lipase on the capillary endothelium — simultaneously stopping fat release and promoting fat uptake. At the liver it suppresses gluconeogenesis and glycogenolysis and activates glycogen synthesis and, via SREBP-1c, lipogenesis. At muscle it drives GLUT4 translocation.
Glucagon rises as insulin falls, driving hepatic glycogenolysis then gluconeogenesis. The insulin: glucagon ratio rather than either alone sets hepatic direction.
Catecholamines stimulate lipolysis via β-adrenergic receptors and are the acute signal during exercise and stress. Cortisol promotes proteolysis and gluconeogenesis and favours visceral fat deposition. Growth hormone is lipolytic and protein-sparing, which is central to the protein conservation of prolonged fasting. Thyroid hormone sets the basal rate against which everything else operates.
8. The sequence of fasting
Postprandial (0–4 h). Insulin high, exogenous fuel dominates, glycogen filling.
Postabsorptive (4–16 h). Insulin falls, hepatic glycogenolysis supplies glucose, lipolysis resumes, RQ falls.
Early fasting (16–48 h). Liver glycogen largely exhausted. Gluconeogenesis takes over, drawing on glycerol, lactate and amino acids — so nitrogen losses are highest in this window. Ketogenesis begins.
Adapted fasting (beyond ~72 h). Ketone bodies supply a growing share of brain fuel, which reduces the gluconeogenic demand for amino acids. Protein-sparing adaptation — nitrogen excretion falls substantially. Growth hormone rises; thyroid T3 falls.
The clinical consequence is that lean-tissue loss is front-loaded. A single prolonged fast in a person with ample fat reserves costs relatively little protein; repeated fasting cycles pay the expensive early phase each time.
PART II — NORMAL REGULATION OF BODY WEIGHT
9. The fed state
Insulin rises; lipolysis is suppressed almost completely; lipoprotein lipase directs circulating triglyceride into adipocytes; glucose enters muscle via GLUT4 and is oxidised or stored as glycogen; the liver stops producing glucose and starts storing it. Net flux is inward. In a metabolically healthy person insulin peaks around 40–60 µU/mL after a mixed meal and returns to baseline within two to three hours.
10. The fasted state
Insulin falls below the antilipolytic threshold. Hormone-sensitive lipase and adipose triglyceride lipase are disinhibited; free fatty acids and glycerol enter the circulation; muscle and liver switch to fat oxidation; the liver supplies glucose for the brain and red cells. Net flux is outward.
Fat loss happens in this state and essentially only in this state. The proportion of the day spent in it is therefore not a detail — it is the mechanism.
11. Adipose tissue as an endocrine organ
Adipose is not inert storage. Leptin is secreted in proportion to fat mass and signals energy sufficiency to the hypothalamus; it falls disproportionately during weight loss, which is a large part of why weight loss is defended. Adiponectin is insulin-sensitising and, unusually, falls as fat mass rises. Adipose also secretes inflammatory cytokines once it becomes dysfunctional (§16).
12. Central control of intake
The arcuate nucleus carries two opposing populations: orexigenic NPY/AgRP neurons and anorexigenic POMC/CART neurons. Leptin and insulin both inhibit the first and stimulate the second. Gut peptides — ghrelin before meals, peptide YY, GLP-1 and cholecystokinin after — provide the meal-by-meal layer.
Weight loss shifts all of these toward intake, and the shift persists. Sumithran (PMID 22029981, n=50) measured leptin, peptide YY, cholecystokinin, insulin, ghrelin, GIP and pancreatic polypeptide one year after a 13.5 kg loss and found every one of them still significantly different from baseline (all P ≤ 0.04).
13. Why weight is defended in both directions
Overfeeding raises expenditure and suppresses appetite; underfeeding lowers expenditure and raises appetite. The system behaves like a settling point — an equilibrium set jointly by biology and environment — rather than a fixed set point, but the defence is real and asymmetric: the response to energy deficit is considerably stronger than the response to surplus.
PART III — HOW INSULIN RESISTANCE DEVELOPS
14. Adipose expandability — the primary constraint
The leading model (Virtue & Vidal-Puig, PMID 20056169) holds that each person has a ceiling on how much lipid their subcutaneous adipose can safely store, set largely by the capacity to recruit new adipocytes rather than simply enlarge existing ones.
Below that ceiling, surplus energy is stored safely and metabolic health is maintained at quite high fat mass. Above it, incoming lipid has nowhere designated to go.
This is why insulin resistance is not a function of BMI. It is a function of whether storage capacity has been exceeded — which is why metabolically healthy obesity and lean insulin resistance both exist, and why population thresholds differ (§39).
15. Ectopic lipid and the molecular lesion
Once the depot ceiling is passed, lipid accumulates in liver, skeletal muscle and visceral depots. The accumulating intermediates, not the triglyceride itself, are the toxic species.
Diacylglycerol activates protein kinase C — PKCε in liver, PKCθ in muscle — which serine-phosphorylates IRS-1. Serine phosphorylation at these sites prevents the normal tyrosine phosphorylation that propagates the insulin signal, so the PI3K–Akt arm is disabled downstream of a perfectly functional receptor. Ceramides contribute through a parallel route inhibiting Akt.
This is Shulman’s mechanism, assembled from two decades of tracer and biopsy work (Samuel & Shulman, Cell 2012, PMID 22385956; JCI 2016, PMID 26727229; the definitive review is Petersen & Shulman, Physiol Rev 2018, PMID 30067154). It is a body-of-work claim rather than a single-experiment one.
16. Inflammation as a parallel route
Hypertrophied adipose recruits macrophages, which polarise toward an inflammatory phenotype and secrete TNF-α and IL-6. These activate JNK and IKKβ, which serine- phosphorylate IRS-1 at the same inhibitory sites. So inflammation and lipotoxicity converge on one lesion. A persistently raised CRP in an insulin-resistant patient is this process made visible.
17. Beta-cell compensation and the hyperbola
Insulin sensitivity and β-cell secretion are related hyperbolically — Kahn’s 1993 result (PMID 8405710, n=93). As sensitivity falls, secretion must rise along that curve for glucose to stay constant. Their product, the disposition index, is what predicts progression to diabetes (Utzschneider, PMID 18957530).
Two clinical consequences. Glucose is the last thing to move, so a normal fasting glucose excludes nothing. And fasting insulin is the early marker, because it is the compensation itself.
18. Selective resistance — pathway by pathway
Resistance is pathway-specific, not whole-body. Signalling downstream of IRS-1/PI3K degrades; branches running through MAPK and other routes remain fully responsive. Because the pancreas is now delivering two to three times the normal insulin concentration to every tissue, hyperinsulinaemia amplifies everything still listening.
| Tissue / pathway | Status | Consequence |
| Muscle glucose uptake (GLUT4) | Resistant | Carbohydrate diverted; glycaemic pressure |
| Hepatic glucose output (FOXO1) | Resistant | Gluconeogenesis not switched of |
| Hepatic lipogenesis (SREBP-1c) | Preserved | Steatosis, hypertriglyceridaemia |
| Adipose antilipolysis | Preserved, and most sensitive of all | Fat release restrained |
| Renal tubular Na⁺ reabsorption | Preserved | Sodium and water retention, hypertension |
| Ovarian theca androgen synthesis | Preserved | The PCOS loop |
| Sympathetic outflow | Preserved | Raised tone |
| Endothelial NO (PI3K) vs ET-1 (MAPK) | Resistant vs preserved | Net vasoconstriction |
Brown and Goldstein called this “a pathogenic paradox” (PMID 18249166), and their central finding is sharper than it is usually reported: mice with total hepatic insulin resistance show hyperglycaemia without hypertriglyceridaemia, and that state is less severe than selective resistance. The harm comes from the organ obeying half the instruction, not from it going deaf.
19. Natural history
Normal → compensated insulin resistance (euglycaemia, hyperinsulinaemia, raised HOMA-IR, raised HOMA-B) → impaired fasting glucose and impaired glucose tolerance (β-cell output begins to fail) → type 2 diabetes (compensation lost). The compensated phase commonly lasts ten to twenty years and is asymptomatic apart from difficulty losing weight, which is why that complaint is itself a screening indication.
PART IV — WHY WEIGHT BEHAVES DIFFERENTLY ONCE INSULIN RESISTANCE EXISTS
20. The dose-response hierarchy — the organising fact
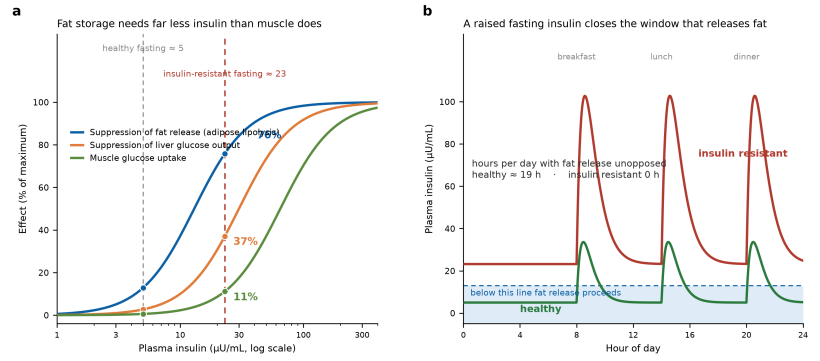
Insulin’s actions do not share a threshold. From clamp and tracer studies:
Nurjhan 1986 (PMID 3533681, n=13) measured half-maximal suppression of glycerol appearance — fat release — at 13 ± 2 µU/mL, and half-maximal suppression of glucose appearance at 26 ± 2 µU/mL, twice as high (P < 0.001).
Stumvoll 2000 (PMID 11061533, n=13) refines this and the refinement matters. Intramuscular triglyceride lipolysis has a lower EC50 than subcutaneous adipose — 44 vs 68 pmol/L, i.e. about 6.3 vs 9.8 µU/mL — but adipose suppression is far more complete: under high insulin, muscle retained 53 ± 4 % of baseline lipolysis while adipose retained only 22 ± 2 % (P < 0.001).
Muscle glucose uptake requires substantially more, with half-maximal effect in the region of 60–70 µU/mL.
So the accurate statement is not “adipose is the single most insulin-sensitive tissue.” It is: both lipolytic pools respond at single-digit to low-double-digit insulin concentrations, adipose is the one shut down nearly completely, and both are an order of magnitude more sensitive than muscle glucose uptake.
Modelled on those thresholds, a person with a fasting insulin of 23 µU/mL has roughly three-quarters of the brake on fat release already applied while barely a tenth of muscle glucose uptake is engaged. They are maximally good at storing fat and barely functional at clearing sugar, at the same hormone concentration.
21. The compressed lipolytic window
Panel b of the figure above is the consequence across a day.
A metabolically healthy person has fasting insulin of 3–8 µU/mL and returns to it between meals, spending the large majority of the 24 hours below the antilipolytic threshold — hours in which fat leaves storage unopposed.
A person with a fasting insulin above 20 never crosses below that threshold at all. Not overnight, not between meals, not ever.
This is the central pathophysiology of weight stagnation. Fat loss is not forbidden. The window in which it occurs has been compressed from most of the day to none of it, so any given energy deficit must be paid through a far narrower aperture.
22. Metabolic inflexibility
Insulin-resistant muscle loses the RQ swing described in §6. Kelley (PMID 10905472) showed it shows increased glucose oxidation under basal conditions and decreased glucose oxidation under insulin stimulation — the switch is blunted in both directions. Mitochondrial oxidative capacity and fatty-acid entry via CPT1 are reduced, so fatty acids that are released are less efficiently oxidised and more readily re-esterified or deposited ectopically, feeding §15.
23. Partitioning toward storage
Carbohydrate that resistant muscle will not take up reaches a liver whose lipogenic arm is fully intact (§18). The result is de novo lipogenesis, VLDL export and hepatic steatosis. Energy is partitioned toward storage rather than oxidation — not because of a surplus, but because the destination options have changed.
24. Appetite
Large insulin excursions followed by steep falls produce reactive hunger, classically in the mid-to-late afternoon after a carbohydrate-dominant lunch or a long morning gap bridged by a sweetened drink. Hypothalamic insulin and leptin signalling is itself impaired, blunting satiety. The craving is a predictable consequence of the insulin curve rather than a failure of resolve — a point worth making explicitly to patients.
25. The renal sodium channel — why the scale misreports
Everything above concerns fat. This is separate, and it is what the scale actually measures.
Insulin is directly antinatriuretic. DeFronzo 1975 (PMID 1120786, n=6) infused insulin under euglycaemic conditions and urinary sodium excretion fell from 401 ± 46 to 213 ± 18 µeq/min (P < 0.02) — a 47 per cent reduction, independent of glucose, aldosterone and renal haemodynamics. Water follows sodium.
The renal pathway appears to be preserved in insulin resistance (Horita, PMID 27247938; Nizar, PMID 30135311 — mouse). Since the pancreas is delivering two to three times normal insulin, the kidney receives a stronger retention signal than it would in a metabolically healthy person eating the same meal.
Net effect: body water oscillates by one to two kilograms on fluid alone, which exceeds the fat anyone can lose in a fortnight. The scale reports the sum of a slow fat signal and a large fluid signal, and the fluid dominates.
Note on evidence strength: the existence of insulin antinatriuresis is solid human physiology; the claim that it is selectively preserved in insulin resistance rests on review and animal work and is weaker than its popularity suggests.
26. The self-reinforcing loop
Hyperinsulinaemia → more lipogenesis and less lipolysis → more fat → ectopic spillover once the depot ceiling is passed → worse IRS-1 signalling → more resistance → higher insulin.
Mehran 2012 (PMID 23217255) provides the provocative counterpoint that hyperinsulinaemia may be partly causal rather than purely compensatory: Ins1⁺/⁻:Ins2⁻/⁻ mice were completely protected from diet induced obesity. A mouse gene-dosage model, not yet translated, but it argues the loop runs in both directions.
PART V — THE PHYSIOLOGY OF WEIGHT LOSS
27. What actually leaves the body
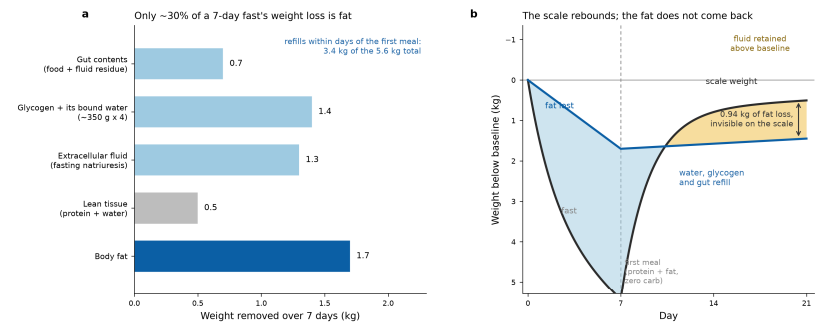
A seven-day total fast in an adult of roughly 90 kg removes about 5–6 kg on the scale, decomposing approximately as: gut contents 0.5–1.0 kg; glycogen with its bound water 1.0–1.5 kg; extracellular fluid via fasting natriuresis 1.0– 2.0 kg; lean tissue 0.3–0.6 kg; and body fat 1.5–1.8 kg.
The fat figure is not an estimate of effort — it is a ceiling. At roughly 7,700 kcal per kilogram of adipose tissue and a cumulative deficit of about 13,500 kcal, no seven-day fast can remove more than about 1.8 kg of fat. Everything above that number was something else.
Yang & Van Italie 1976 (PMID 956398, n=6, three 10-day periods) is the cleanest demonstration in the literature. On an 800-kcal ketogenic diet subjects lost 466.6 g/day. On an isocaloric mixed diet they lost 277.9 g/day. Same calories, nearly double the weight loss — and the difference is glycogen and water, not fat.
28. Glycogen and its water
Each gram of glycogen is stored with about 3 g of water (Olsson & Saltin, PMID 5475323). Depleting 500 g of glycogen therefore removes about 2 kg of body weight for 2,000 kcal of energy. Refilling it returns the same 2 kg.
Kreitzman 1992 (PMID 1615908, n=11) added the compositional detail that early body- potassium changes on verylow-calorie diets primarily reflect glycogen — about 0.45 mmol of potassium released per gram of glycogen — which distorts body-composition estimates that assume potassium tracks lean mass.
Carbohydrate restriction therefore produces a rapid, large and entirely genuine scale movement that contains almost no fat. On refeeding it reverses. Patients should be warned of both halves before they start, or the first week teaches them the wrong lesson and the second week teaches them a worse one.
29. Adaptive thermogenesis
Energy expenditure falls during weight loss by more than the loss of tissue mass predicts — typically an additional 10–15 per cent beyond the mass-predicted decline. Mechanisms include falling leptin and T3, reduced sympathetic tone and improved skeletal-muscle work efficiency. The effect persists while the reduced weight is maintained.
30. Hormonal counter-regulation
§12 above. The key clinical fact is its duration: Sumithran’s hormone profile was still abnormal at twelve months. Weight-loss maintenance is an active physiological struggle against a persistent signal, not a matter of residual willpower.
31. The plateau is arithmetic, not failure
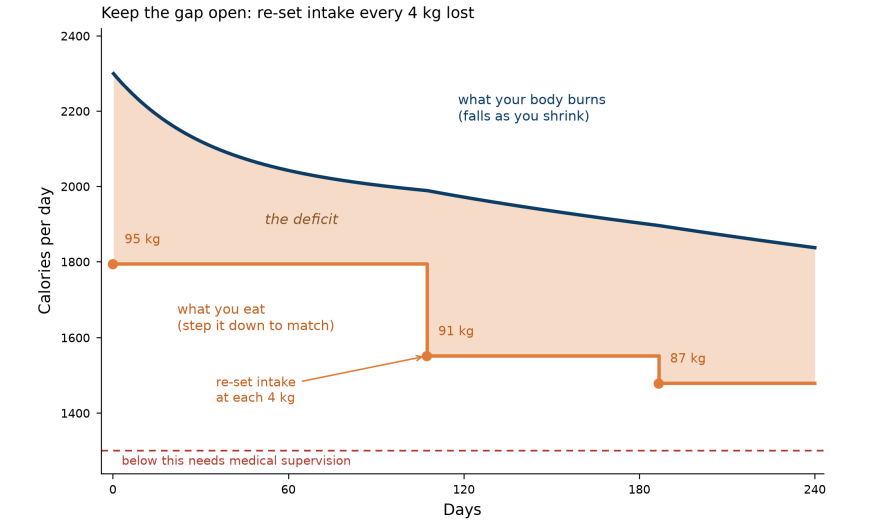
Maintenance expenditure scales with body mass. As weight falls, maintenance falls with it, so a fixed calorie target becomes a progressively smaller deficit and eventually no deficit at all. Modelled for a 95 kg adult at 2,300 kcal maintenance with 10 per cent adaptive thermogenesis: a fixed 400 kcal/day cut stalls at −5.6 kg, and a fixed 500 kcal/day cut stalls at −8.7 kg. Neither ever reaches 10 kg.
The remedy is to set the deficit as a percentage of current maintenance (20–25 per cent) and re-set it at every 4 kg lost.
A second and underappreciated constraint follows for smaller patients:
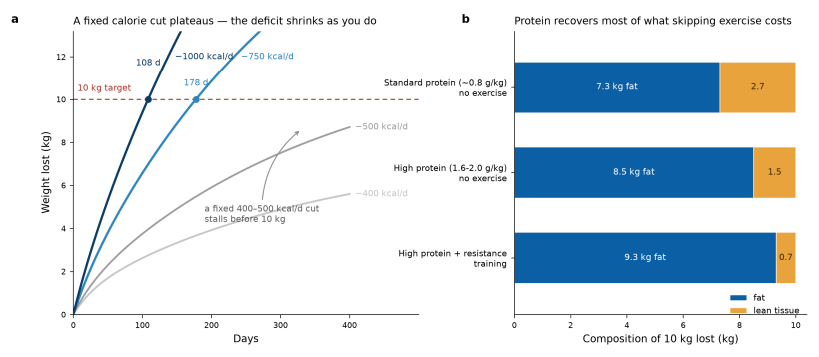
Because intake cannot safely fall below roughly 1,200 kcal/day in women or 1,500 in men without medical supervision, a patient with a low maintenance reaches that floor before a large target is met. At that point food is exhausted as a lever and the only remaining option is to raise expenditure. This converts resistance training and daily step count from general advice into arithmetic necessity, and it is a calculation worth doing explicitly before setting any target.
32. Composition of loss
Without resistance training and at standard protein intake, roughly 20–30 per cent of weight lost is fat free mass. Adequate protein reduces this substantially; resistance training reduces it further.
Wycherley 2012 (PMID 23097268, meta-analysis, n=1,063) found high-protein energy restriction produced 0.79 kg greater weight reduction than standard protein, with fat-free mass sparing reported in the same analysis.
One caveat that is widely misquoted and worth stating precisely. Turicchi 2020 (PMID 31950141, n=209, 26 weeks) found fat-free-mass loss predicted subsequent weight regain in men (β = 0.09, P = 0.009) but not in women (P = 0.69). The case for protein and resistance training in women therefore rests on the insulin-sensitivity mechanism and on function, not on this regain association.
PART VI — THE EVIDENCE, GRADED
A framing point: tier reflects design, not quality. A dose-response question can only be answered by a clamp study; a randomised trial is the wrong instrument for it. The tiers say what kind of confidence a claim carries.
33. What is established
The dose-response hierarchy — tier C human physiology, and it is the right design. The numbers are specific and replicated.
β-cell compensation is hyperbolic and glucose moves last — tier C, n=93, with prospective cohort confirmation that the disposition index predicts diabetes.
Insulin retains renal sodium — tier C, small n, clean effect.
Most early weight loss on energy restriction is water and glycogen — tier C, and the isocaloric comparison in Yang & Van Itallie makes it close to definitive.
Hormonal counter-regulation persists at one year — tier B cohort, n=50.
GLP-1-based pharmacotherapy produces large weight reduction — tier A, the strongest evidence in this entire document. SURMOUNT-1 (PMID 35658024, n=2,539, 72 weeks): tirzepatide 15 mg −20.9 % vs −3.1 % placebo. STEP 1 (PMID 33567185, n=1,961, 68 weeks): semaglutide 2.4 mg −14.9 % vs −2.4 %, difference −12.4 percentage points.
Resistance training improves insulin sensitivity before weight changes — tier C but mechanistically decisive. Croymans (PMID 23970530, n=28, 12 weeks) found improved muscle insulin sensitivity (P = 0.03) alongside HK2, GLUT4 and AKT2 protein content up 26–33 % (all P < 0.02). Mikines (PMID 3126668, n=7) showed a single bout raises insulin-mediated glucose uptake for 48 hours.
Sleep restriction impairs fat loss at an identical deficit — tier B crossover, n=10, 14 days: fat loss 1.4 kg at 8.5 h sleep vs 0.6 kg at 5.5 h (P = 0.043), with the loss shifting into lean tissue.
34. What is contested, or not supported
The strong carbohydrate–insulin model is not supported. Hall 2016 (PMID 27385608, n=17, randomised crossover, metabolic ward) found an isocaloric ketogenic diet increased energy expenditure by 151 ± 63 kcal/d and yet body fat loss slowed. DIETFITS (PMID 29466592, n=609, 12 months) found −5.3 kg low-fat vs −6.0 kg lowcarbohydrate, a difference of 0.7 kg (95 % CI −0.2 to 1.6), with no interaction with baseline insulin secretion.
Intermittent fasting is not superior to continuous restriction. Templeman 2021 (PMID 34135111, n=36, 3 weeks) found daily energy restriction reduced body fat by 1.75 ± 0.79 kg while alternate-day fasting at matched energy restriction reduced it by 0.74 ± 1.32 kg (P = 0.01) — fasting performed worse.
Whether hyperinsulinaemia is causal — mouse evidence only (Mehran).
Whether renal insulin sensitivity is specifically preserved in human insulin resistance — review and animal evidence; the human measurement has not been done directly.
The defensible synthesis: insulin is a powerful modifier of the rate and destination of fat flux, and not an override of energy balance.
35. What is unknown
No randomised trial has tested whether lowering insulin specifically — as distinct from losing weight — improves fat loss. That is the experiment the field most needs and has not done.
Most mechanistic physiology rests on groups of 6 to 30 people, predominantly male, predominantly European, and mostly acute two-hour infusions rather than chronic states. Population-specific thresholds (§39) are review-level with no trial testing whether they should change clinical targets.
PART VII — CLINICAL IMPLICATIONS
36. Measurement
Fasting insulin and HOMA-IR detect the condition a decade before glucose does. A normal fasting glucose excludes nothing (§17).
Waist circumference outperforms weight for tracking fat, because tape responds almost entirely to fat while weight is dominated by fluid (§25).
Weekly averages, never single readings. With a 1–2 kg fluid oscillation against a 0.2–0.5 kg weekly fat change, any single daily weight is predominantly noise.
Triglyceride-to-HDL ratio is a useful, inexpensive everyday surrogate for insulin sensitivity, and discordance between it and HOMA-IR is informative rather than confusing.
37. The intervention hierarchy, read backwards from the mechanism
- Muscle contraction opens a GLUT4 route that does not require insulin. It is the only lever that lowers the insulin cost of a meal directly, and it works before any weight is lost (§33).
- Protein defends the sink itself and carries the highest thermic effect and satiety.
- Lengthening the genuinely low-insulin interval — an earlier last meal, no sweetened drink on an empty stomach — restores part of the missing window of §21 without a fast.
- The energy deficit, set as a percentage and re-set at intervals (§31).
- Sleep, which is worth roughly half the fat-loss rate at the same deficit.
- Pharmacotherapy, which has by a wide margin the strongest outcome evidence and is a physician’s decision.
38. Why resistance training is treatment rather than advice
Not because muscle burns energy at rest — §5 shows it does not. Because contraction-mediated glucose uptake bypasses the defective signalling step entirely, and because training builds a permanently larger sink, lowering the insulin required for every subsequent meal. Croymans measured the transporters themselves increasing by a quarter to a third in twelve weeks.
39. Modifying contexts
PCOS. Insulin and LH act together on ovarian theca cells to raise androgen production; the androgen pattern worsens insulin resistance. The ovarian pathway is among those preserved in selective resistance (§18), so hyperinsulinaemia drives it harder. The loop is bidirectional and treating it as one condition rather than two is what changes outcomes.
South Asian phenotype. Insulin resistance appears at substantially lower BMI, consistent with a lower adipose expandability threshold and higher visceral and hepatic lipid at any given weight (Yajnik, PMID 20705620). BMI systematically understates metabolic load, and waist is the better clinical measure in this population.
Anaemia. Reduced oxygen delivery blunts the training response that lowers insulin resistance, so correcting it is not a parallel project but a prerequisite. Iron studies precede iron treatment, since microcytosis has several causes and inflammation raises ferritin independently.
Medication. Insulin sensitivity improves early in an energy deficit, sometimes faster than a prescription anticipates. Glucose-lowering, antihypertensive and diuretic doses may need review, and fluid shifts during carbohydrate restriction interact directly with diuretics.
APPENDICES
A. Constants and reference values
| Quantity | Value |
| Energy density, adipose tissue | ~7,700 kcal/kg |
| Energy density: fat / carbohydrate / protein / alcohol | 9 / 4 / 4 / 7 kcal/g |
| Water bound per gram of stored glycogen | ~3 g |
| Potassium released per gram of glycogen | 0.45 mmol |
| Liver glycogen / muscle glycogen | ~100 g / ~400 g |
| Thermic effect: protein / carbohydrate / fat | 20–30 % / 5–10 % / 0–3 % |
| Skeletal muscle RMR | 13 kcal/kg/day |
| Adipose tissue RMR | 4.5 kcal/kg/day |
| Half-maximal insulin, suppression of lipolysis | 13 ± 2 µU/mL |
| Half-maximal insulin, suppression of glucose appearance | 26 ± 2 µU/mL |
| Healthy fasting insulin | ~3–8 µU/mL |
| Safe intake floor without supervision | ~1,200 kcal (women), ~1,500 (men) |
B. Formulas
HOMA-IR = fasting glucose (mg/dL) × fasting insulin (µU/mL) ÷ 405 — target < 2.6 HOMA-B = 360 × fasting insulin (µU/mL) ÷ (fasting glucose (mg/dL) − 63) — normal ≈ 100 % Mifflin–St Jeor RMR = 10·W(kg) + 6.25·H(cm) − 5·A(y) + 5 (men) or − 161 (women) Sedentary total expenditure ≈ RMR × 1.2 Devine reference weight = 45.5 (F) or 50 (M) + 2.3 kg per inch over 5 ft Adjusted body weight = reference + 0.4 × (actual − reference) Triglyceride-to-HDL ratio — favourable below 2.0
C. Unit conversions
Insulin: 1 µU/mL = 6.945 pmol/L · Glucose: 1 mmol/L = 18.0 mg/dL · Waist: 1 inch = 2.54 cm
D. Reference list
| PMID | Study | Design, n | Used for |
| 3533681 | Nurjhan 1986, Diabetes | Tracer/clamp, n=13 | Lipolysis EC50 13±2 vs glucose 26±2 µU/mL |
| 11061533 | Stumvoll 2000, JCEM | Clamp, n=13 | Depot-specific lipolysis EC50 and completeness |
| 8405710 | Kahn 1993, Diabetes | Physiology, n=93 | Hyperbolic sensitivity–secretion relation |
| 18957530 | Utzschneider 2009, Diabetes Care | Prospective cohort | Disposition index predicts diabetes |
| 18249166 | Brown & Goldstein 2008, Cell Metab | Animal | Selective vs total hepatic resistance |
| 22385956 | Samuel & Shulman 2012, Cell | Synthesis | DAG–PKC–IRS-1 mechanism |
| 26727229 | Samuel & Shulman 2016, JCI | Synthesis | Signalling and substrate flux |
| 30067154 | Petersen & Shulman 2018, Physiol Rev | Synthesis | Definitive mechanism review |
| 10905472 | Kelley 2000, Diabetes | Synthesis | Metabolic inflexibility |
| 20056169 | Virtue & Vidal-Puig 2010, BBA | Synthesis | Adipose expandability |
| 1120786 | DeFronzo 1975, J Clin Invest | Clamp, n=6 | Na⁺ excretion 401±46 → 213±18 µeq/min |
| 27247938 | Horita 2016, Biomed Res Int | Review | Selective renal insulin sensitivity |
| 30135311 | Nizar 2018, JCI Insight | Animal | Renal tubule insulin receptor |
| 4704714 | Boulter 1973, Metabolism | Physiology | Starvation natriuresis time course |
| 956398 | Yang & Van Itallie 1976, J Clin Invest | Balance study, n=6 | 466.6 vs 277.9 g/day, isocaloric |
| 5475323 | Olsson & Saltin 1970, Acta Physiol Scand | Physiology | Glycogen-bound water |
| 1615908 | Kreitzman 1992, Am J Clin Nutr | Physiology, n=11 | 0.45 mmol K per g glycogen |
| 27385608 | Hall 2016, Am J Clin Nutr | RCT crossover, n=17 | EE +151±63 kcal/d, fat loss slowed |
| 29466592 | Gardner 2018, JAMA | RCT, n=609, 12 mo | −5.3 vs −6.0 kg; no insulin interaction |
| 34135111 | Templeman 2021, Sci Transl Med | RCT, n=36 | 1.75±0.79 vs 0.74±1.32 kg fat |
| 23217255 | Mehran 2012, Cell Metab | Animal | Insulin gene dosage and obesity |
| 20921542 | Nedeltcheva 2010, Ann Intern Med | RCT crossover, n=10 | 1.4 vs 0.6 kg fat, P=0.043 |
| 22029981 | Sumithran 2011, NEJM | Cohort, n=50, 62 wk | Hormones altered at 12 months |
| 23970530 | Croymans 2013, J Appl Physiol | Trial, n=28, 12 wk | GLUT4/HK2/AKT2 +26–33 % |
| 3126668 | Mikines 1988, Am J Physiol | Clamp, n=7 | 48-hour post-exercise sensitivity |
| 23097268 | Wycherley 2012, Am J Clin Nutr | Meta-analysis, n=1,06 | 0.79 kg greater weight reduction |
| 31950141 | Turicchi 2020, Am J Clin Nutr | RCT, n=209 | FFM loss predicts regain in men only |
| 35658024 | Jastreboff 2022, NEJM | RCT, n=2,539 | Tirzepatide −20.9 % vs −3.1 % |
| 33567185 | Wilding 2021, NEJM | RCT, n=1,961 | Semaglutide −14.9 % vs −2.4 % |
| 21484913 | Wang 2011, Am J Hum Biol | Compilation | Organ-specific metabolic rates |
| 15102614 | Levine 2004, Am J Physiol | Review | NEAT variability |
| 20705620 | Yajnik 2010, Int J Low Extrem Wounds | Review | South Asian phenotype |
Compiled and curated by Soumick Mondal Raj and Claude Science.
Assembled from the primary literature cited above. Quantitative results were extracted from the published abstracts rather than recalled, and each is attributed to its source study. This is a physiological reference, not clinical guidance for any individual patient.